Understanding Skellerup Holdings
Upon opening the spreadsheet and discovering that my allocated company was an industrial supplier by the name of Skellerup Holdings, I was honestly feeling a little discouraged. I already felt out of my depth in this subject and had hoped that I would be allocated a company that was familiar to me – or at least a company that operated in an industry I was familiar with. I have never heard of Skellerup Holdings before, nor do I have I had any previous exposure to industrial and agricultural manufacturing. However, I re-assured myself that starting with a ‘clean slate’ – a company and industry that I know nothing about it – is actually a fantastic way to have a truly immersive, engaged learning experience, as it’s going to actually require me to actively pursue information and understanding!

My company is the New Zealand based Skellerup Holdings, who are a designer, manufacturer, and distributor of agricultural and industrial rubber products – more specifically, polymer and elastomer products and vacuum systems. The company was founded in 1910 by George Skellerup, and now employs close to 800 people in New Zealand, Australia, the United States, the United Kingdom, and China. Their products are supplied to a wide range of customers, including those in the dairy, mining, automotive, plumbing and other water related industries. Skellerup Holdings are a parent company for a number of industrial and agricultural businesses. Their agricultural businesses are almost all dairy-specific, and include Stevens Filterite, Conewango and Ambic. I am aware that New Zealand has a strong dairy industry, so I am not surprised that this New Zealand based industrial and agricultural company is heavily involved in the dairy industry. In contrast, Skellerup Holdings industrial interests are much more diverse, with their portfolio including businesses such as DEKS, Gulf Rubber, Tumedei, Ultralon, Masport, SRS and Skellerup Flexiflo. Skellerup Holdings industrial portfolio seems large and diverse – although most of the businesses manufacture and supply polymer and elastomer products in some capacity, they seem to cater to different markets and niches – which, in a global economy, I assume is a smart thing to do.
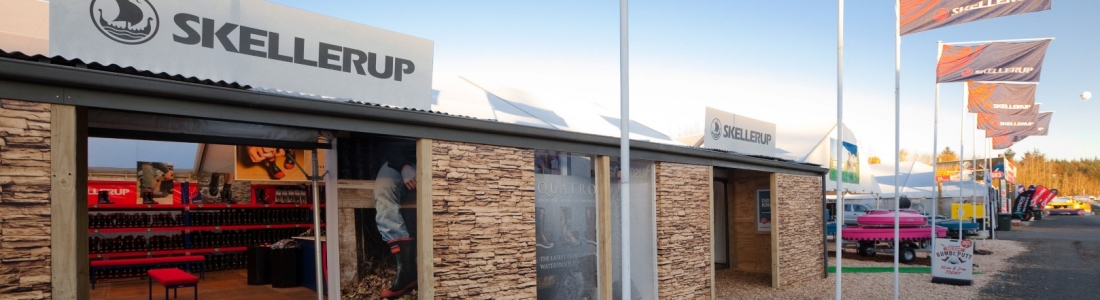
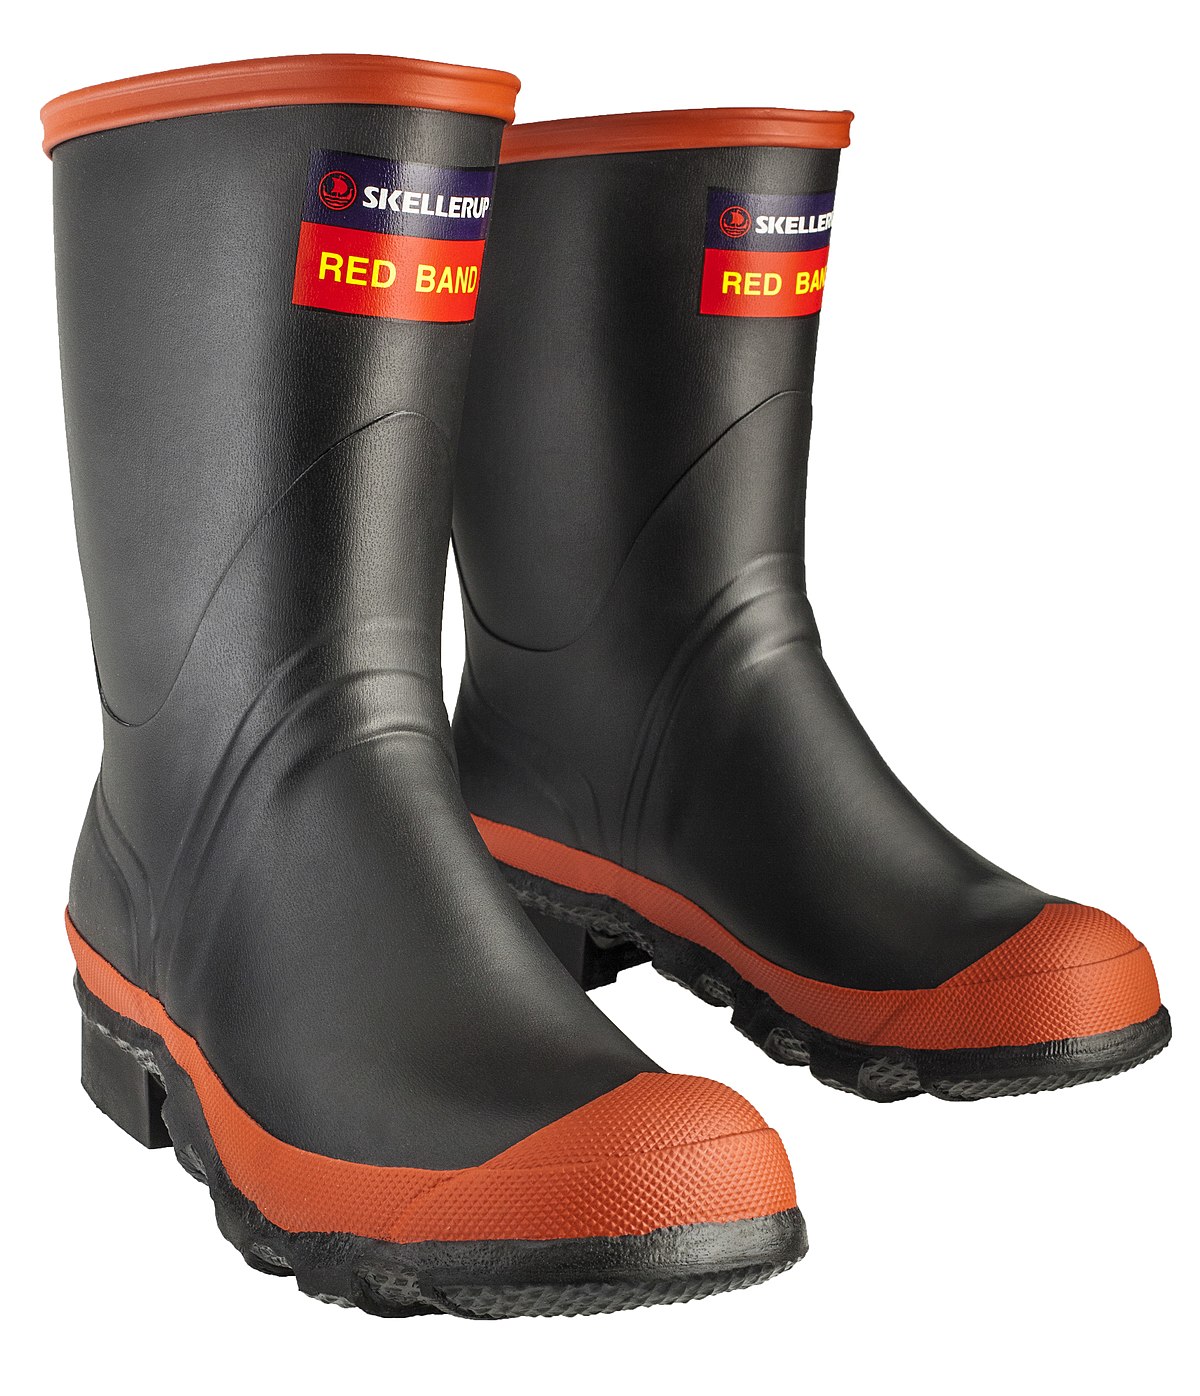
Upon Googling my company, I wasn’t expecting to find many – if any – interesting articles about sudden stock price crashes, insider trading, scandals amongst the board members, or any criminal activities. Why? I try to keep up with the news, and I have never once seen the name ‘Skellerup’ on the 7pm bulletin. An industrial/ agricultural company isn’t whom we usually expect to hear about, nor are they interesting enough to write an expose about – unlike media, banking and retail companies. However, during my research I was pleasantly surprised in finding that the Skellerup brand is an iconic company and household name in New Zealand. “Jandals” is the common name for flip flops (pluggers or thongs here in Australia) and is a trademark of Skellerup Holdings, with the company also a leading producer of gumboots.
Although I have only found a few articles analyzing Skellerup Holdings as an investment option, all have been positive. An article published by Yahoo Finance in December of 2018 describes the company as having strong financial health, and “undervalued with excellent balance sheet and pays a dividend” (Yahoo Finance, 2018). Another article published in late January 2019 questions whether Skellerup Holdings is spending too much money, describing its current positive free cash flow yield of 3.93% as “…not sufficient to compensate for the level of risk investors are taking on” (Simply Wall St, 2019). The article then analyzes Skellerup’s expected operating cash flows over the new few years, –which, to my surprise – are expected to grow by a whopping 41%. The author of the article summarizes by declaring that these figures are only encouraging for investors if “… capital expenditure levels maintain at an appropriate level” (Simply Wall St, 2019). The last and most recent article I was able to find discusses how Skellerup investors have seen the share price rise 62% over the last three years. The article points to a few influencing factors, namely the company’s year-on-year earnings growth, resulting in an increasingly improved market opinion of Skellerup Holdings. Upon concluding my company research I am somewhat humbled by my discoveries, from what I thought was a boring, dreary allocation I have found an iconic company who provide a range of products which many of our influential industries rely on – and in addition, I have uncovered a company that is producing positive growth for its employees and investors. I am excited to now delve into Skellerup Holdings Annual Reports and see what information I can uncover from its financial statements.
Discussion & KCQs: Skellerup Holdings Latest Annual Report
The Skellerup website was exceptionally easy to navigate, with small and precise parcels of information regarding their company over view, board members and governance, their role in the agricultural and industrial industries, and an entire swag on financial information (including a banner displaying their current share price). This leads me to believe that this website was crafted specifically for prospective investors, and upon studying Skellerup Holdings most recent 2018 Annual Report, I am even more inclined to think this is the case, which shares a similar inviting readability.
At first glace, the company seems to be doing very well financially in the last year; a 14% increase in revenue, a 23% increase in earnings per share, and a 16% increase in dividends. Skellerup Holdings is also performing well from a human resources point of view, with their total injury rate down by 16% and a 3% growth in their global team. A quick study of the companies 2017 Annual Report shows consistent positive increases over the last 24 months in the company’s earnings per share and dividends, whilst the yearly revenue figure held stable. Skellerup Holdings 2016 Annual Report paints a slightly different picture, with a small increase in revenue, a decrease in earnings per share and no change in dividend figures. This tells me that although 2016 and 2017 weren’t overwhelmingly negative years, they were quite tumultuous – that is, until 2018. Skellerup Holdings look to have had an overwhelmingly successful 2018 financial year, however to confirm my assumptions I will need to dive a little deeper into their Annual Reports, and study the Income Statement, Balance Sheet and Statement of changes in Equity.
The company’s 2018 Income Statement highlights a large increase in revenue, gross profit, and basic and diluted earnings per share between 2017 and 2018. Despite these increases, the 2018 distribution, marketing, administration and “other” expenses were all held closely to the previous 2017 expense figures. Using the insights I gained whilst reading Chapter 3, I am finding the Income Statement easy to read and understand. From what I gather, these are the figures used to create the colorful, eye-catching info-graphics presented at the start of the Annual Report. The following document is the Statement of Comprehensive Income, which I did have trouble understanding. I am not sure what cash flow hedges or overseas subsidiaries mean, however will engage in a little more of my own research after this to figure out what exactly they are.

Next up is the company’s balance sheet, and thanks to Chapter 3, I have a rudimentary understanding of the information that’s being presented. Comparing 2017 and 2018 figures, Skellerup Holdings Balance sheet describes strong growth in the overall total assets held by the company. Although growth the company’s current assets was strong – including cash and cash equivalents increasing by nearly a third – the company did not record any growth in its non-current assets. In fact, Skellerup Holdings reported a small decrease in the amount of property, plant and equipment held by the company. In the face of a large cash and overall asset increase, I don’t believe a decrease in property, plant and equipment to be a bad thing – especially if this decrease is due to a selling off of unused or under-utilized machinery (for example). Skellerup Holdings Balance Sheet also describes an increase in the total current liabilities of the firm, but a decrease in the firm’s total non-current liabilities. Overall, a small increase in the company’s total liabilities was recorded, however I do not assume this to be negative as this may indicate that the firm is currently involved in the transfer of economic resources with another firm – or rather, it is “doing business.” The disparity between 2017’s liabilities and 2018’s is not great enough to cause worry or confusion – especially in the face of positive asset growth.
Next is the Statement of Changes in Equity, and although I don’t understand exactly what a Cash Flow Hedge Reserve or what an Employee Share Plan Reserve is, I am able to use the data to come to the conclusion that although there was a small positive growth in dividends and total equity between 2016 and 2017, there was a much larger improvement between 2017 and 2018.

The following Cash flow Statement is not as hard to comprehend as the previous statements, thanks to its use of plain language. This statement describes an overall increase of cash and cash equivalents held by the company by more than a third, when comparing 2017 and 2018 figures. Skellerup Holdings increased their net cash flow in operating and financing activities, however decreased this net cash flow from investing opportunities. This is found quite interesting, and as I mentioned before I had a hunch that the company may have been selling some of their assets that fall underneath ‘property, plant and equipment.’ This may be true, as statements describes the 2018 ‘proceeds from sale of property, plant and equipment’ figure to be more than four times larger than the figure for 2017. Strangely, the ‘payments for property, plant and equipment’ figure does not represent this change – it’s actually a smaller figure for 2018 than 2017. What I suspect might be happening is that Skellerup Holdings is in the process of off-loading the equipment, therefore we might have to wait until the 2019 Annual Report to see this change represented in the figures.
Skellerup 2018 Annual Report 2018
Skellerup 2018 Annual Report 2017

One thought on “Assignment 1: Step 3”